Corrections and bear markets are associated with falling share markets. The difference between the two is the magnitude of the fall. A correction is typically defined as a share market fall of 10%. A bear market is typically defined as a fall of 20% peak to trough. As you can see in red on the below chart, the average intra year drop is 13.8% in the US since 1980.
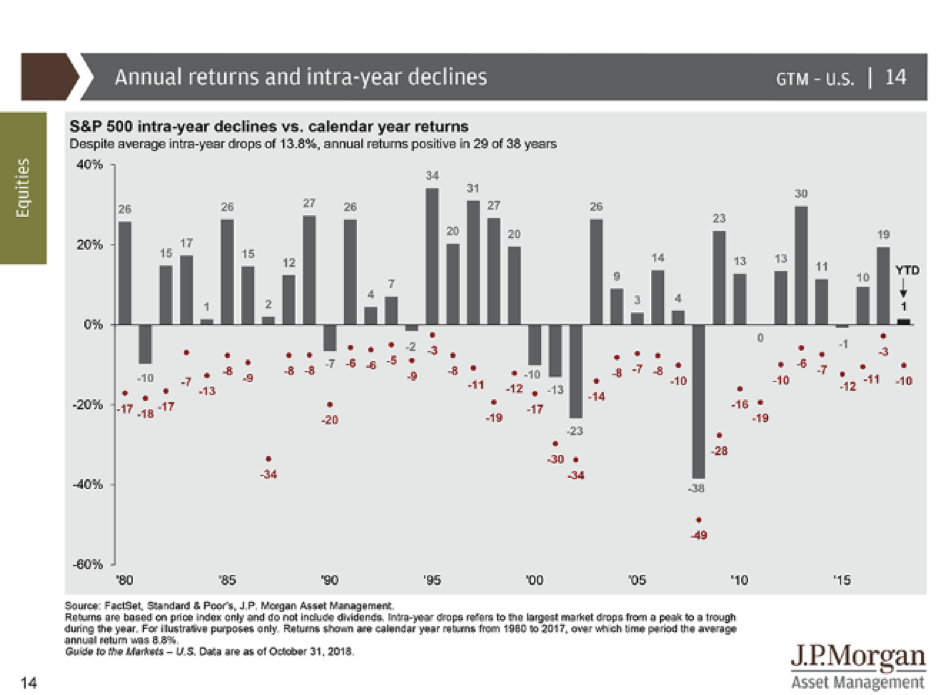
A correction is generally a normal yearly event.
Share market falls are something we should be mentally prepared for every year and they can happen for no real rhyme or reason.
The share market is good at creating volatility and noise but it’s interesting to note the grey bars at the top of the chart, the result at the end of the year. Markets can be very volatile but still end positive.
What is a bear market?
But what if the market drops further, how do we know if it’s just a correction or whether it’s a bear market?
Falls of over 20% are generally a genuine concern to investors.
Corrections are more common than bear markets and can happen for no identifiable reason.
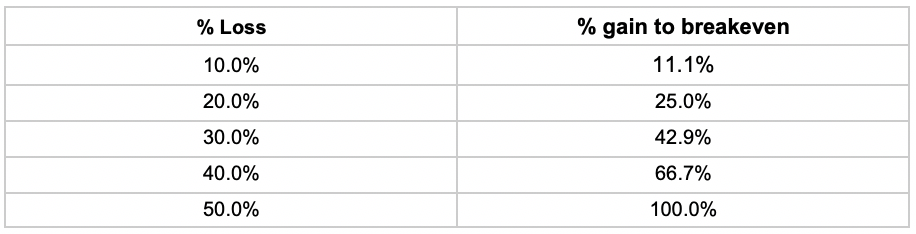
But bear market falls of over 20% tend to have a reason. The more a market falls the more growth needed to recover to breakeven. We find that a bear market checklist can be helpful as large falls require an even larger gain just to get back to breakeven.
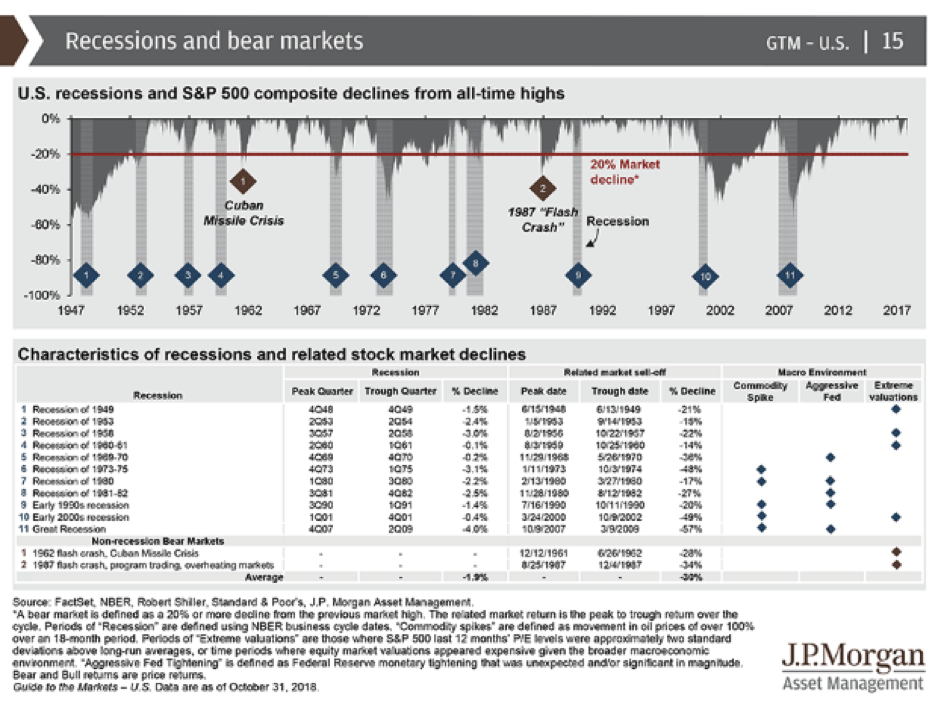
There have been 13 bear markets since World War II.
JP Morgan found 4 common events around each bear market. They generally were a:
- Recession
- Commodity Spike
- Aggressive Federal Reserve in raising interest rates
- Extreme valuations
Source: ‘Guide to the Markets: 4Q 2018’, 31 October 2018, J.P. Morgan Asset Management
Our approach to the checklist is below:
- We find that recessions are hard to predict, by the time we know it tends to be too late. So this is generally in the “too hard basket” because we just don’t know.
- Thankfully shale oil in the US has increased oil supply reducing the risk of a large commodity oil spike. Low risk.
- Aggressive Federal Reserve, interest rate rises are a risk but interest rates are still below long term averages. Medium risk.
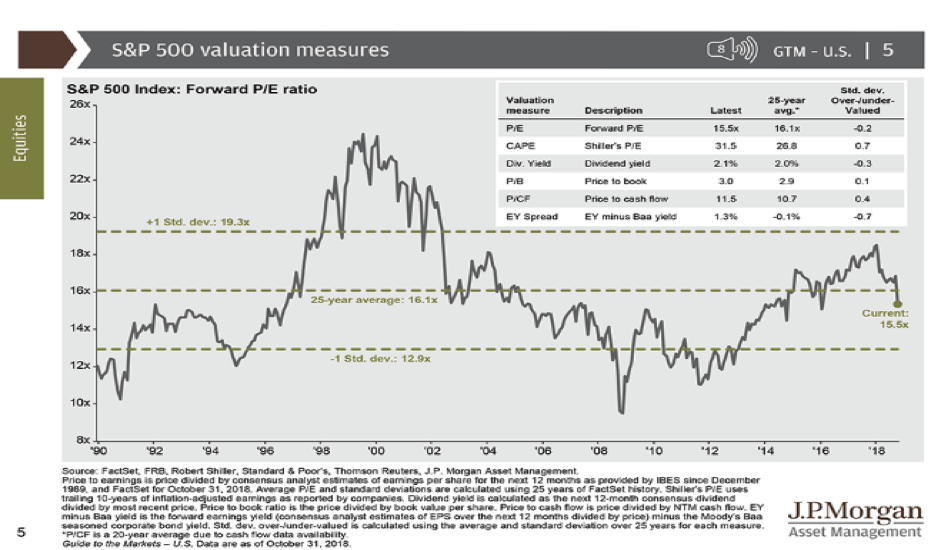
- Valuations are below long term price earnings multiples even though interest rates are well below long term averages (see below), suggesting extreme valuation is not a risk. Low risk.
Whilst past performance is not a reliable indicator of future performance, we believe that we should be prepared for an average 13.8% correction every year. Forewarned is forearmed.