Tech stocks are generally better known for being high growth engines than typical Warren Buffett style value stocks. We’ve seen the headlines that tech stock valuations are bubble-like and it’s a matter of time before the bubble bursts.
With the recent price correction in tech stocks, we’d challenge that narrative. In our view, some of the largest tech companies in the world (some members of the FAANG + BAT group) are actually bargains for value-oriented investors.
What are FAANG and BAT stocks?
The FAANG + BATs, Facebook, Apple, Amazon, Netflix and Alphabet (Google) in the United States, and Baidu, Alibaba and Tencent in China, are among the the titans of the technology world.
Today’s technology industry is reasonably mature, both in front-end products and the back-end infrastructure that supports the new internet economy. With the majority of the world’s population now connected to the internet and with mobile phones within our reach every minute of the day, we believe this creates opportunity for technological disruption across all industries.
The demands of innovation are also rising. Big tech is re-investing significant capital into their own businesses, utilising their strong profit margins and cash reserves. They’re the top R&D spenders among US companies, with Amazon and Alphabet (Google) spending $22.6bn and $16.6bn in 2017 respectively. Some believe that their key to success is how much they invest in their own technology, allowing them pull away from their smaller peers and take the lion's share of profits.
Although, Wall Street investors are typically skeptical about how much bigger these big tech companies will get, we think these companies are just hitting their stride. In our view, they are now formidable competition for every company in every sector and their moats are deeper than ever before.
How are companies like these valued?
Price to earnings per share (P/E ratio) is a popular valuation tool used by investors. Another valuation metric that’s common is enterprise value to EBITDA (earnings before interest, tax, depreciation and amortisation), which is similar to price to earnings except it takes into account a company’s debt position.
Essentially these ratios try to measure how much an investor needs to invest into a company in order to receive $1 of the company’s earnings. The higher the ratio, the more expensive a company looks relative to how much profit it’s producing.
The price to earnings ratio for the S&P 500 is 18x, which means the average company in the S&P 500 trades on a market valuation of 18 times its last reported net profit. For companies in the ASX200, the price to earnings ratio is 16x.
Other valuation methods include discounted cash flow valuation (which is more precise than earnings multiples but requires more assumptions and is less directly comparable across companies), price to sales (usually used for companies that don’t make any profit yet) and sum of the parts valuation (usually used for companies operating across multiple business lines or industries).
Valuations usually also depend on the company’s industry and the nature of its earnings. For instance, markets appear to value software companies at higher multiples than tech hardware companies as they are higher margin and less capital intensive.
What's an expensive company vs a cheap one?
A high price to earnings ratio doesn’t necessarily mean a company is expensive and a low price to earnings ratio doesn’t mean it’s cheap. The fundamental measure used in these metrics (i.e. the earnings in the price to earnings ratio) is just a basic, point-in-time number. This number may not be at all representative of future earnings.
Take cyclical stocks for instance. When there’s a fall in the oil price, such as in 2015 when the price of oil dropped to $36.05/barrel, the earnings of some oil producers earnings may fall significantly. But when the oil price rises again, fortunes will likely reverse.
For high growth tech companies, last year’s earnings are generally less important than expected long-term development of the company’s addressable markets, the company’s potential market share and the level of return on capital it may expect to earn.
Therefore, we think it's better to focus on long-term or normalised earnings compared to today’s price or market valuation. It’s not one year’s worth of earnings that matters, but the prospective earnings stream over many years.
Nonetheless, we find that these simple valuation metrics based on last year or next year’s earnings are still useful as a starting point to thinking about valuations as they compare to earnings today, without any assumptions of future growth.
This brings us back to the FAANGs and BATs.
Netflix and Amazon trade on very high earnings multiples based on last year/next year’s profit, as we believe investors recognise they are in earlier stages of the product cycle than their peers and are disruptors in large addressable markets. We think that their products are also largely under monetised at the moment as they build scale and market share. Netflix hiked prices in 2017 as well as earlier this month, and we think they are likely do so again. At $10/month in Australia, a Netflix subscription is arguably still too cheap. We also think that Amazon can probably grow its gross margins within e-commerce.
However, some of the other companies in the group appear to trade on very reasonable earnings multiples, some of them close to or below the broader market, indicating that investors are pessimistic about their growth prospects.
We look at three interesting big tech investment ideas below:
Facebook is valued marginally higher than the average stock in the S&P 500, trading at 20 times last years earnings and 18 times next year’s expected earnings. This is at a similar level, if slightly lower, compared to large cap US stocks like Procter and Gamble, McDonalds, and Coca Cola.
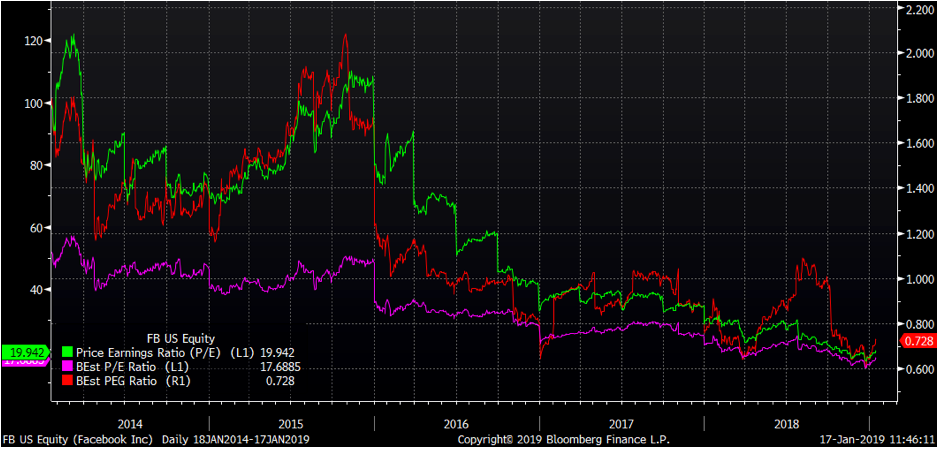
However, we expect Facebook to grow earnings at a much greater rate than the market
Facebook’s embarrassing Cambridge Analytica scandal appears to have overshadowed the fact that Facebook is still growing strongly. Its revenues grew 33% year from Q3 2017 to Q3 2018, in reported results. While lower than Facebook’s growth rate in the past, it’s still higher than most of its FAANG peers and far higher than the market.
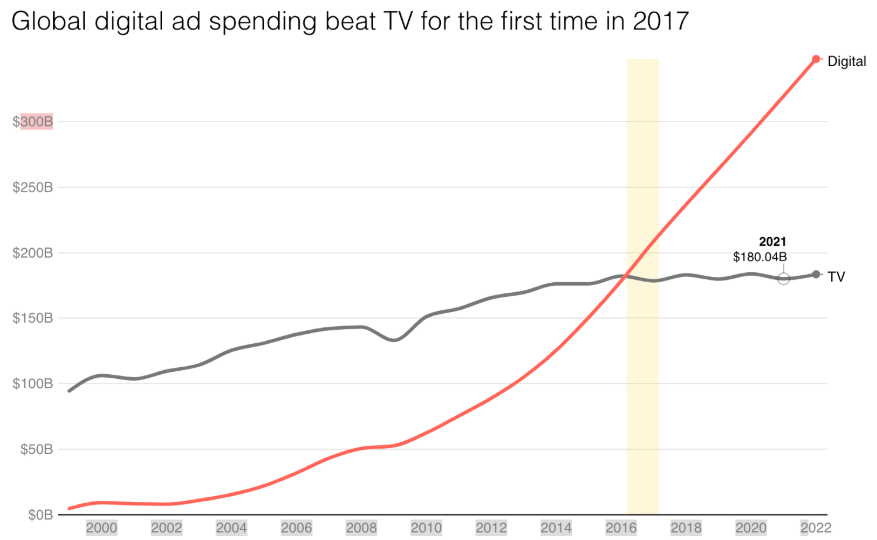
Facebook and Alphabet (Google) continue to dominate digital advertising, with Facebook having an estimated ~20% market share in a rapidly growing industry.
The Cambridge Analytica scandal has not led to users abandoning Facebook as it had been feared. Though user growth appears to be plateauing in its core platform, Facebook’s other properties, Instagram, Whatsapp and Messenger are still growing its user base quickly and the company has only just started to make money from them. We think the market is underestimating the long-term monetisation potential of these other properties.
Long term, Facebook is investing heavily in the technology that’s likely to dominate the future, with key areas of focus being artificial intelligence, virtual and augmented reality and connectivity (through drones, satellites and undersea cables). In the last 12 months to September 2018, Facebook spent $9.4bn research and development.
While regulation is a risk, the earnings impact looks like it's being overestimated by investors. We believe that extensive ads transparency reporting or data privacy protections could even entrench Facebook’s dominance in social media, making it harder for startups in the same space to emerge and become a true alternative to Facebook.
Apple
While Apple became the first publicly traded company to reach a US$1 trillion market cap (though has since fallen well below that threshold), it’s actually far cheaper than the average stock on the S&P 500 from an earnings multiple perspective, trading on 13 times last year’s earnings and 13 times next year's expected earnings.
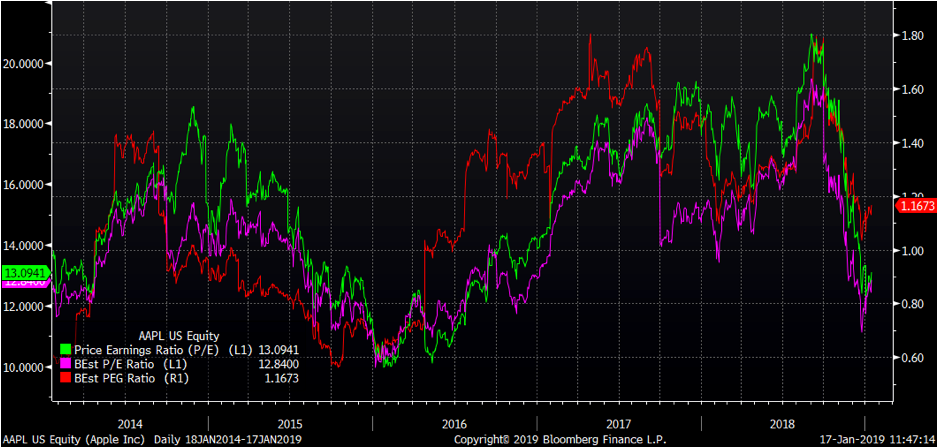
We expect Apple to grow earnings in line or greater than the market in the near term. In the long term, we believe Apple can leverage its ecosystem to achieve higher than market growth.
While Apple appears to be in a lower growth stage than FAANG peers due to its sheer size, we still think it has a number of growth levers. The obvious one to us is Apple’s services division, which includes AppleCare, Apple Music, App Store, iTunes, Apple TV and Apple Pay. Apple services revenue grew 17.5% year on year in the last period and we expect it to continue to grow as a proportion of overall revenue (currently its 16% of revenue). Consequently, we think that Apple could be re-valued at a higher multiple by investors as they transition to higher margin and more recurrent services-based revenue. Another area of growth for the company may be Apple Watch and other wearables.
Is this enough to displace the iPhone, the powerhouse product that contributed 59% of company’s sales in 4Q18? Probably not in the short term. When the concern that iPhone unit sales were flattening out first emerged three years ago, Apple was able to mitigate the earnings impact by increasing prices. They can’t increase prices forever so decelerating iPhone sales is a legitimate earnings risk.
Apple has built a tightly integrated ecosystem of products and incredible brand loyalty. It follows that Apple is not losing its user base to competitors and the ecosystem remains extremely sticky. We believe that this should help Apple maintain its iPhone earnings stream (ensure its user base is continually upgrading to the latest iPhone), as well as leverage its massive user base to sell them services and tap future areas of growth.
Like the other big tech firms, Apple continues to reinvest a large proportion of its earnings back into R&D and position itself for the long term. Apple is paving the way for an entry into health care devices through the new Apple Watch, which received regulatory approval for its ECG functionality in the United States. Apple has also been laying the groundwork for augmented reality (through its AR developer kit) and development of self-driving transportation products.
Baidu
Baidu is China’s answer to Google. It’s the largest search engine in China, supported by market leading maps, news and travel apps. Baidu also owns 57% of iQiyi, China’s Netflix / Youtube, 20.5% of Ctrip, China’s leading online travel agency and 2.3% of Didi Chuxing, China’s Uber.
Like the other Chinese tech stocks, Baidu stocks have been caught up in a brutal emerging market sell-off, exacerbated by trade war tensions between China and the United States and a weaker economic outlook domestically. Baidu’s share price is down ~40% from its peak this year[PJ49] .
Unlike their Western counterparts, the BATs own large stakes in other, smaller tech companies. So, it’s more accurate to value stocks like Baidu using a sum-of-the-parts approach. If we strip out Baidu’s investments in iQiyi, Ctrip and Didi Chuxing, this values core Baidu at ~US$47bn at today’s prices and a 9.5x enterprise value to trailing 12 month EBITDA multiple (compared to 12x for the S&P 500, 10x for the Shanghai Composite and 17x for the Nasdaq Composite)
Like Facebook, we expect Baidu to grow at a much greater rate than the broader market.
Baidu’s core internet search business remains dominant, capturing 68.5% market share in China as of November this year, and appears to be very profitable. There are plenty of opportunities for Baidu to grow its core business with 58% of China’s population online in 2018 compared to 89% in the United States in 2018. While there were concerns about Google returning to China with a censored search engine earlier this year, we believe that this probably won’t happen after the employee backlash against leaked plans.
Baidu has two key growth levers that are still relatively early stage. Majority owned streaming platform iQiyi is the top player in an industry that is in the early stages of establishing a subscription paying user base and still has a low household penetration rate (as compared to Netflix in the US). iQiyi benefitted when Netflix was banned in China, with Netflix subsequently deciding to license some of its exclusive content to iQiyi. The company is yet to be profitable.
Baidu also appears to be a key player in the emerging Artificial Intelligence industry, with deep expertise in machine learning due to its dominance in search. One noteworthy AI venture is Apollo, it’s autonomous driving platform, which counts over 130 partners including car manufacturers. While we believe that Apollo is probably still behind Waymo in the underlying technology, China’s government wants 10% of cars to be self-driving by 2030, so we think Apollo will probably face less regulatory setback than its US competitors.
Bottom Line: We believe that these big tech companies offer solid risk/reward prospects for patient investors. They appear to be trading on earnings multiples in line or cheaper than the market, despite possessing strong moats and growth levers that set them apart from the average company. While there are downside risks, we believe there’s more opportunity for upside. Investing during times of uncertainty can often provide the best investment opportunities in the long run.
Spaceship Universe Portfolio and the Spaceship Index Portfolio invests in Facebook, Alibaba, Alphabet, Amazon, Apple, Netflix and Tencent. Spaceship Universe Portfolio also invests in Baidu.
Important! We’re sharing with you our thoughts on the companies in which Spaceship Voyager invests for your informational purposes only. We think it’s important (and interesting!) to let you know what’s happening with Spaceship Voyager’s investments. However, we are not making recommendations to buy or sell holdings in a specific company. Past performance isn’t a reliable indicator or guarantee of future performance.